
File list
This special page shows all uploaded files.
| Date | Name | Thumbnail | Size | Description | Versions |
|---|---|---|---|---|---|
| 11:59, 21 April 2018 | AMOC.jpg (file) |  |
23 KB | Schematic representation of the Atlantic Meridional Overturning Current. | 1 |
| 17:25, 7 August 2023 | AbraAlba.jpg (file) |  |
3 KB | ''Abra alba'' | 1 |
| 12:34, 19 February 2020 | AbstractionUpconing.jpg (file) |  |
92 KB | Salt water upconing under an abstraction well. | 1 |
| 17:31, 21 April 2020 | AcaciaLongifoliaSophorae.jpg (file) |  |
53 KB | Acacia Longifolia subsp. Sophorae (coastal wattle) Photo credit: Jan Juc Coast Action 2017 https://scnaturesearch.com.au/plant/Coast%20Wattle | 1 |
| 15:25, 14 April 2020 | AcaciaSophorae.jpg (file) |  |
110 KB | Acacia sophorae (Coastal Wattle) Photo credit Sheldon Navie | 1 |
| 17:46, 21 February 2020 | AccraCloggedDrainageCanals.jpg (file) |  |
167 KB | Clogged drainage canals in Accra (Ghana). Photo credit TU Delft. | 1 |
| 15:30, 24 April 2018 | ActiveCoastalZone.jpg (file) |  |
112 KB | Schematic representation of the active coastal zone for a dune coast. | 1 |
| 23:46, 22 February 2019 | AdaptationMeasuresUSAID.jpg (file) |  |
911 KB | Climate adaptation measures for the coastal zone (USAID, 2009) | 1 |
| 12:24, 26 September 2021 | AichiTargets.jpg (file) |  |
827 KB | AICHI Biodiversity Targets. | 1 |
| 12:31, 5 April 2020 | AirborneTEM.jpg (file) |  |
45 KB | SkyTEM team recording Time Domain Electromagnetic Data. Source: G. Oude Essink, https://publicwiki.deltares.nl/ | 1 |
| 20:36, 16 October 2023 | AiryFunction.jpg (file) |  |
41 KB | The Airy function. | 1 |
| 17:24, 5 May 2023 | AlexandriaAbuQirBeach.JPG (file) |  |
385 KB | Abu Qir beach, Alexandria. | 1 |
| 17:34, 13 June 2020 | AlgaeBloomModel.jpg (file) |  |
95 KB | Temporal evolution of the algae population P(t) and the nutrient concentration N(t) according to the Lotka-Volterra equations. | 1 |
| 17:33, 13 June 2020 | AlgaeBloomPhasePlane.jpg (file) |  |
115 KB | Solution of the Lotka-Volterra equations (A1, A2) in the N−P phase plane. From Huppert et al. (2002). | 1 |
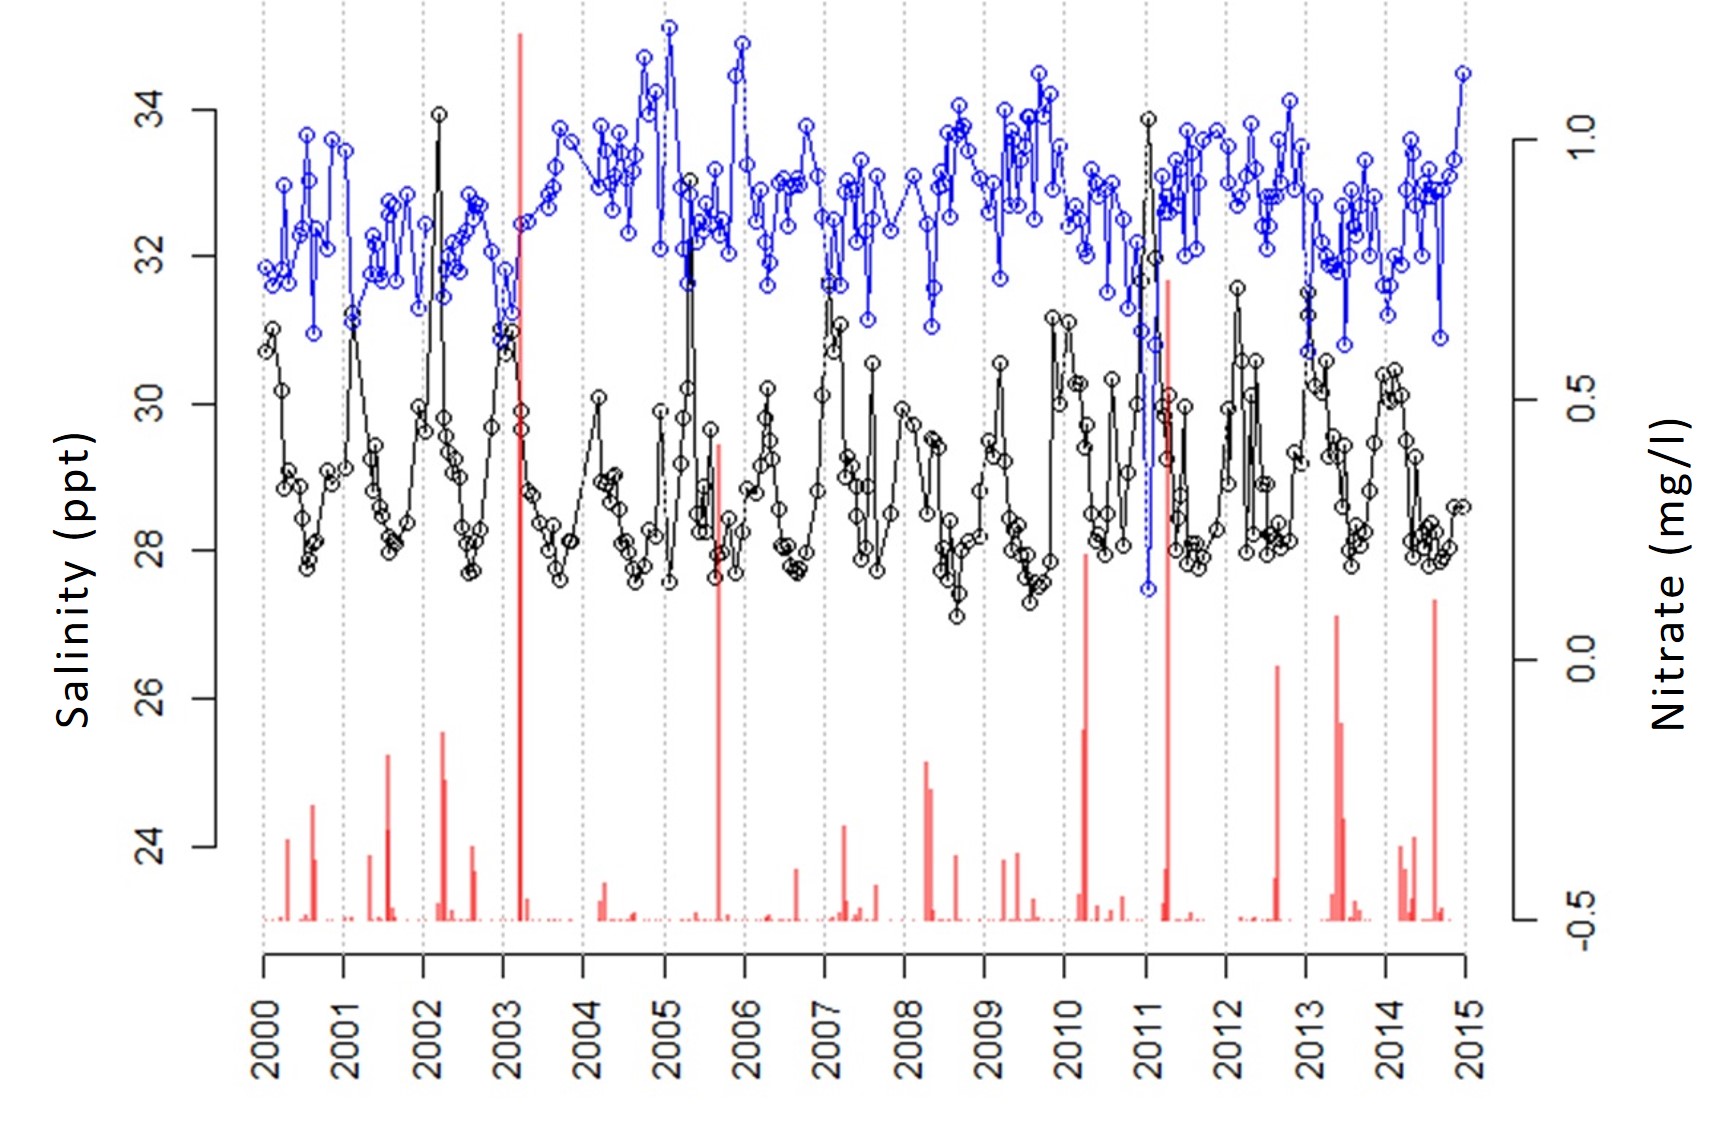
| 16:48, 10 June 2020 | AlgaeBloomTerschelling.jpg (file) |  |
289 KB | Multi-annual observation record of the alga ''Chaetoceros socialis'' at a measuring point in the North Sea 10 km north of the Dutch Wadden island of Terschelling. Simultaneous measurements of the local nitrate concentration and surface salinity. From W... | 1 |
| 15:14, 21 June 2018 | AmericanJackknifeClam jpmm.jpg (file) |  |
243 KB | The American jackknife clam ''Ensis Directus'' has colonized the beaches of NW Europe. Photo credit jpmm, [https://www.flickr.com/photos/jpmm/] | 1 |
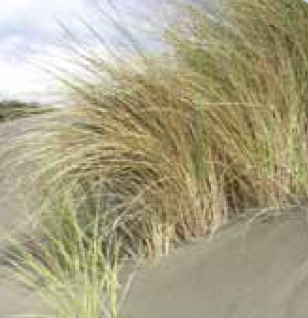
| 11:58, 13 April 2020 | AmmophilaArenaria.jpg (file) |  |
26 KB | Ammophila arenaria (Marram grass) | 1 |
| 15:06, 23 June 2023 | AngleOfRepose.jpg (file) |  |
19 KB | Angle of repose: Equilibrium slope angle of a pile of sediment grains in water. | 1 |
| 17:51, 18 April 2020 | AnthemisMaritima.jpg (file) |  |
78 KB | Anthemis maritima (seaside chamomile) Photo credit: Paolo Formisani https://www.actaplantarum.org/flora/flora_info.php?id=742&pid=-1&p=1 | 1 |
| 23:15, 13 March 2017 | AnticyclonicRidgeCirculation.jpg (file) |  |
57 KB | Vorticity balance at a tidal sand ridge which is rotated anticyclonically with respect to the dominant flood and ebb flow direction. | 1 |
| 22:20, 14 March 2017 | AnticyclonicRidgeCirculation1.jpg (file) |  |
57 KB | Vorticity balance at a tidal sand ridge which is rotated anticyclonically with respect to the dominant flood and ebb flow direction. | 1 |
| 22:23, 14 March 2017 | AnticyclonicRidgeCirculation2.jpg (file) |  |
61 KB | Vorticity balance at a tidal sand ridge which is rotated anticyclonically with respect to the dominant flood and ebb flow direction. | 1 |
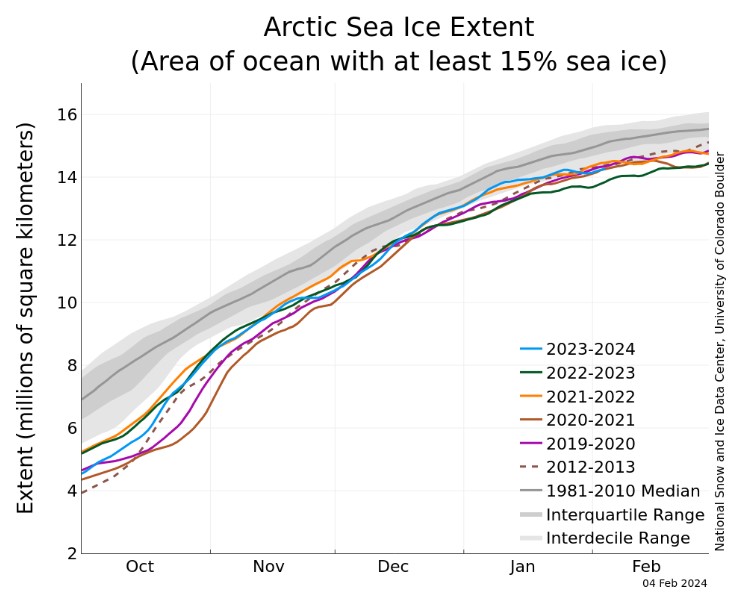
| 19:03, 22 February 2024 | ArcticIceCover.jpg (file) |  |
77 KB | Arctic sea ice extent for several years between 2012 and 2024 compared to the average extent over the period 1981-2010. The gray areas around the median line show the interquartile and interdecile ranges of the data. Image credit National Snow and Ice... | 1 |
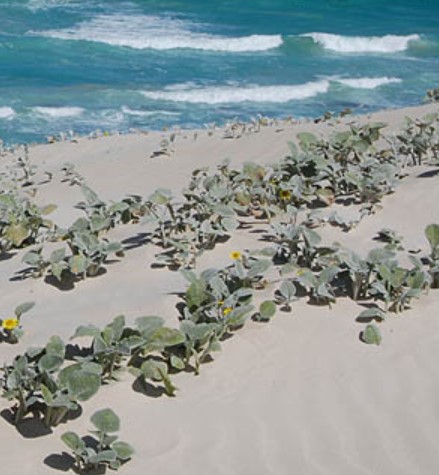
| 21:30, 20 April 2020 | ArctothecaPopulifolia.jpg (file) |  |
54 KB | Arctotheca Populifolia (beach daisy) Photo credit: Ori Fragman Sapir https://www.treknature.com/gallery/Africa/South_Africa/photo144444.htm | 1 |
| 17:25, 7 August 2023 | ArgopectenPurpuratus.jpg (file) |  |
7 KB | ''Argopecten purpuratus'' | 1 |
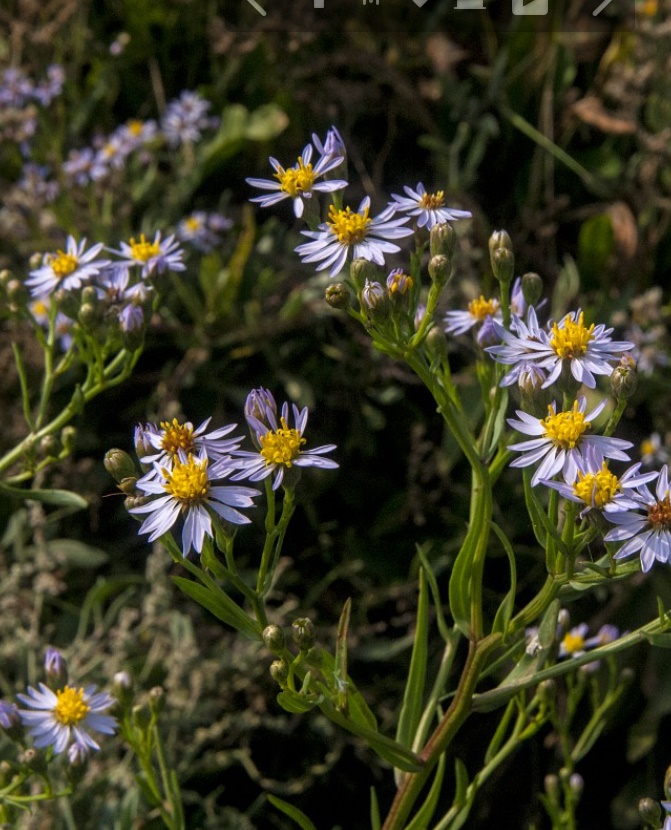
| 11:43, 27 February 2021 | AsterTripolium.jpg (file) |  |
207 KB | ''Aster tripolium'' Credit Jan van der Straaten, Creative Commons Licence. www.freenatureimages.eu | 1 |
| 21:04, 16 December 2020 | AtlanticCod.jpg (file) |  |
211 KB | Atlantic cod. Photo credit NOAA. | 1 |
| 17:47, 26 September 2016 | BaZaFig1.jpg (file) |  |
334 KB | Key elements and the flow of information within THESEUS DSS. | 1 |
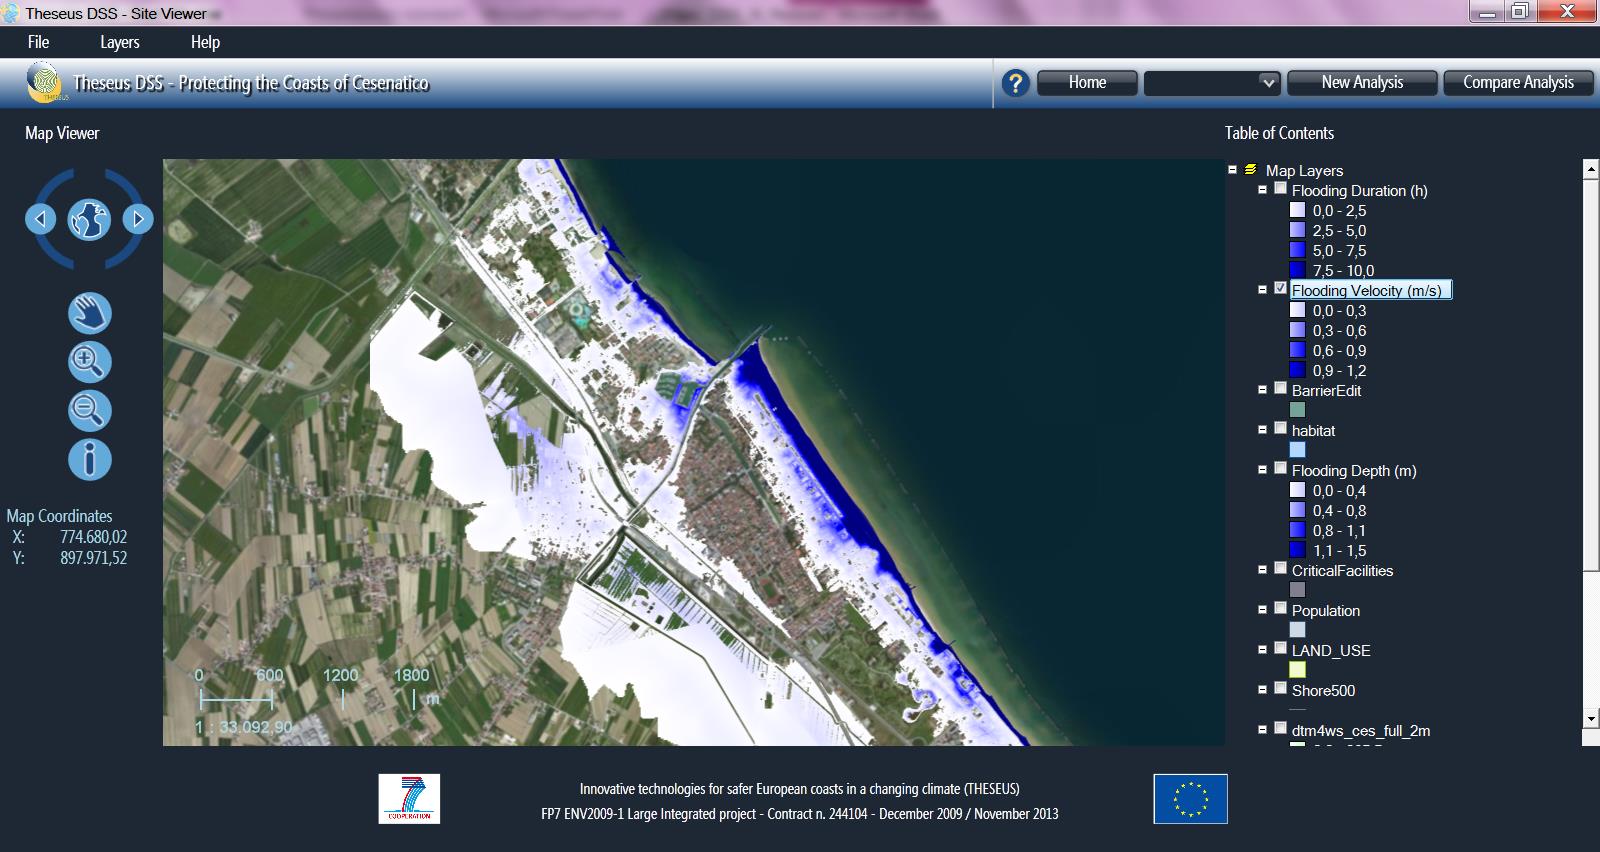
| 17:48, 26 September 2016 | BaZaFig2.jpg (file) |  |
121 KB | The viewer at the start-up. | 1 |
| 17:49, 26 September 2016 | BaZaFig3.jpg (file) |  |
100 KB | Scenarios screen. | 1 |
| 17:49, 26 September 2016 | BaZaFig4.jpg (file) |  |
85 KB | Mitigation screen. | 1 |
| 17:50, 26 September 2016 | BaZaFig5.jpg (file) |  |
74 KB | Editing a mitigation option in front of Cesenatico. | 1 |
| 17:55, 26 September 2016 | BaZaFig6.jpg (file) |  |
163 KB | Example map of flooding velocities derived from the modified watershed segmentation algorithm. | 1 |
| 17:57, 26 September 2016 | BaZaFig7.jpg (file) |  |
151 KB | Example of integrated risk map, scale from 1 to 4 (from low to very high impact). | 1 |
| 17:46, 26 September 2016 | BaZaTable1.jpg (file) |  |
241 KB | Review of existing exploratory tools that can be used for supporting decisions applied to coastal areas. These GIS-based tools perform scenario construction and analysis. | 1 |
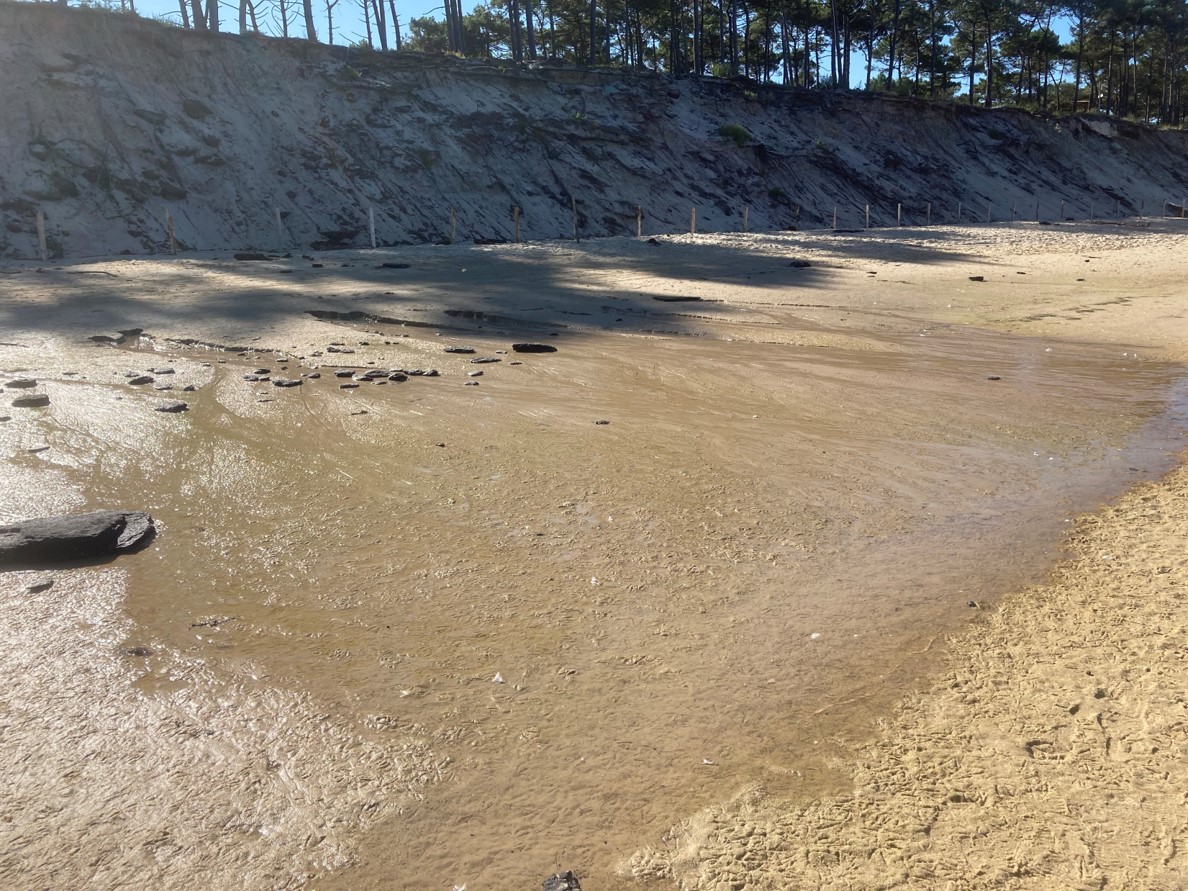
| 15:06, 30 August 2021 | BackshoreGroundwaterUpwelling.jpg (file) |  |
384 KB | Backshore groundwater upwelling, near the foot of the eroded dune face, Aquitaine coast, France. | 1 |
| 23:30, 17 January 2022 | BackshoreNourishment.jpg (file) |  |
56 KB | Backshore nourishment. | 1 |
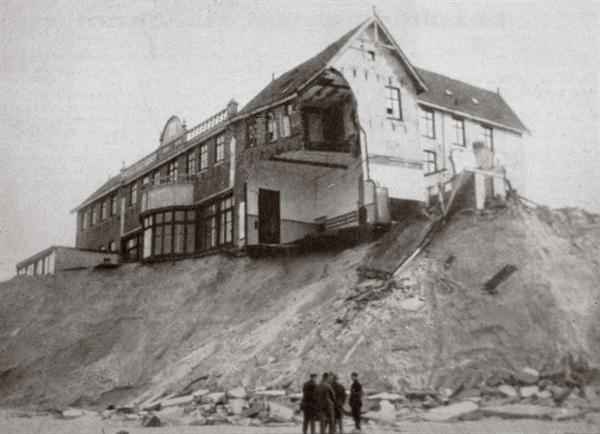
| 12:17, 27 April 2018 | BadhotelSchiermonnikoog 1924.jpg (file) |  |
19 KB | Badhotel at Schiermonnikoog after the 1924 storm. | 1 |
| 21:38, 11 February 2021 | BadonGhyben.jpg (file) |  |
65 KB | A small level difference is sufficient to keep a large fresh water column in balance with a salt water column, according to the BGH principle. | 1 |
| 16:28, 5 April 2020 | BalanceSaltFresh.jpg (file) |  |
65 KB | A small level difference is sufficient to keep a large fresh water column in balance with a salt water column. | 1 |
| 09:04, 30 May 2017 | BaldockFig1.jpg (file) |  |
37 KB | Definition sketch for the nearshore littoral zone (swash zone width exaggerated). | 1 |
| 09:22, 30 May 2017 | BaldockFig10.jpg (file) |  |
333 KB | A LIDAR system mounted above the swash zone, together with ultrasonic distance point sensors. Photo: Dr Chris Blenkinsopp, University of Bath, UK. | 1 |
| 09:05, 30 May 2017 | BaldockFig2a.jpg (file) |  |
328 KB | Seven Mile Beach, NSW, Australia, a dissipative beach. Photo shows conditions after a swash rundown, with only small bores reaching the swash zone. Photo: Dr Hannah Power, University of Newcastle, NSW, Australia. | 1 |
| 09:07, 30 May 2017 | BaldockFig2b.jpg (file) |  |
388 KB | Avoca Beach, NSW, Australia, a reflective beach. Photo shows the inner surf zone and a bore reaching the swash zone in the background and a swash uprush reaching the top of a beach berm in the foreground. Photo: Dr Hannah Power, University of Newcastle... | 1 |
| 09:09, 30 May 2017 | BaldockFig3.jpg (file) |  |
27 KB | Typical pattern of vertical shoreline oscillations (<math>\eta (t)</math>), the mean shoreline position (<math><\eta></math>) and runup maxima(*). From: Stockdon, H. F., Holman, R. A., Howd, P. A. and Sallenger JR, A. H. 2006. Empirical parameterizatio... | 1 |
| 22:26, 30 May 2017 | BaldockFig3NEW.jpg (file) |  |
42 KB | Typical pattern of vertical shoreline oscillations (in metres) as a function of time (seconds). Redrawn from Stockdon, H. F., Holman, R. A., Howd, P. A. and Sallenger JR, A. H. 2006. Empirical parameterization of setup, swash, and runup. Coastal Engine... | 1 |
| 10:14, 31 May 2017 | BaldockFig3NEW2.jpg (file) |  |
50 KB | Typical pattern of bore-driven swash oscillations (vertical component). Data show shoreline elevation versus time at Avoca Beach, NSW. Red and green squares indicate maxima and minima of individual swash events. Data courtesy of Dr Michael Hughes, NSW... | 1 |
| 09:10, 30 May 2017 | BaldockFig4.jpg (file) |  |
73 KB | Swash energy spectra from (a) reflective, (b) intermediate, and (c) dissipative beach-states. From: Hughes, M. G., T. Aagaard, T. E. Baldock and H. E. Power, 2014. Spectral signatures for swash on reflective, intermediate and dissipative beaches. Marin... | 1 |
| 09:11, 30 May 2017 | BaldockFig5.jpg (file) |  |
64 KB | Washover fan deposited on Ocracoke Island, North Carolina, during Hurricane Isabel, September 2003. From: Donnelly, C., N. Kraus and M. Larson, 2006. State of knowledge on measurement and modeling of coastal overwash. Journal of Coastal Research 22: 96... | 1 |
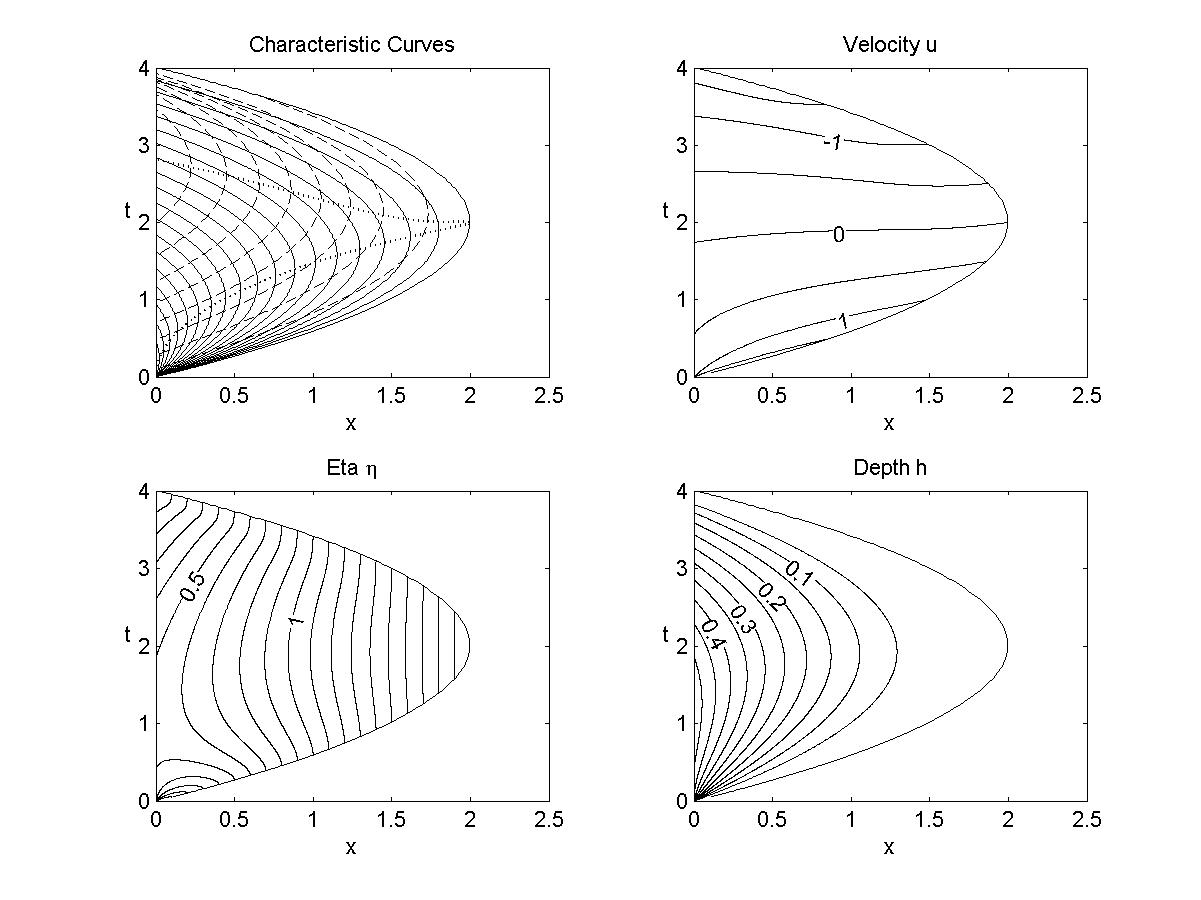
| 09:16, 30 May 2017 | BaldockFig6.jpg (file) |  |
122 KB | Forward (solid) and backward (dashed) characteristic curves (a), and contours of flow velocity (b), surface elevation (c) and depth (d) for swash initiated by a near uniform bore in non-dimensional coordinates. From: Guard, P. A. and T. E. Baldock, 200... | 1 |