
Argus image types and conventions
This article describes aspects related to images created with an Argus video monitoring system. Argus is a video technology, which uses cameras at a fixed mount to collect images from the beach. For a short introduction of Argus, see also Argus video.
Contents
Time-averaged video data
Three types of images are collected for each of the ARGUS station cameras every hour:
- a snapshot image (see Figure 1)
- a time exposure image (see Figure 2)
- a variance image (see Figure 3)
A snapshot serves as simple documentation of conditions, but offers little quantitative information. The time exposure images provide us with much more information. The ten minute time exposures of the nearshore wave field average out natural modulations in wave breaking to reveal a smooth band of white which has been shown to be an excellent proxy for the underlying, submerged sand bar topography (Lippman and Holman, 1989[1] and Van Enckevort and Ruessink, 2001[2]). The third type, the variance image, displays the variance of the light intensity signal during the same ten minutes of time exposure. Variance images help identify regions which are changing in time, from those, which may be bright in the time exposure, but are unchanging in time.

Figure 1: A snapshot image at Egmond aan Zee
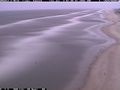
Figure 2: A time exposure image at Egmond aan Zee
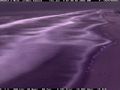
Figure 3: A variance image at Egmond aan Zee


Time series of pixel intensities
Besides time-averaged video data, data sampling schemes can be designed to collect time series of pixel intensities, typically at 2 Hz, with which wave and flow characteristics can be investigated. Pixel intensity time series show the fluctuations in time of the intensity in a pixel. A time stack image is an image in which the intensity of an array of pixels is plotted against time. To illustrate, the figure below shows the strong correlation which is commonly observed between a time series of pixel intensities and the wave height signal obtained from a wave gauge at the same location (Lippmann and Holman, 1990 [3]). The small phase lag between the two indicates that maximum intensities correspond to the white, foam-covered face of the breaking wave, which precedes the passage of the actual wave top. Comparisons for non-breaking waves also show strong coherence, but often a larger, still fixed, phase difference.

In extension of this approach, time series of pixel intensities can be sampled along a cross-shore or alongshore array. The resulting data collection, I(t,y;x), yields a time stack image. Due to the digitalisation process, the intensity data are normalised over the lens’s intensity range and thus dimensionless. The dark, slightly curved patterns represent individual waves propagating onshore. The slope of the wave traces can be used to determine the approximate speed of the shoreward progressive waves, before being dissipated through wave breaking at the shoreline (around x=170 m).

A third type is the longshore timestack from which the longshore current velocity is estimated. The targets for the longshore current analysis are the foam patches that appear on the water surface after the waves have broken on the nearshore bar. These foam patches move slowly alongshore carried by the longshore current. The velocity of the foam patches therefore gives a measure of the longshore surface current velocity (Chickadel & Holman, 2004[4]).


Argus conventions

At every Argus site, the orientation of the x-axis is normal to the shore, with the positive x-axis pointing in seaward direction. The y-axis is directed perpendicular to the x-axis, such that the co-ordinate system thus obtained is positive in mathematical sense. The latter means that the rotation from the x-axis towards the y-axis indicates the counter-clockwise (or ‘positive’) turning direction. As an example, Figure 8 shows the Argus co-ordinate system for Miyazaki, Japan. The vertical reference level (z = 0) is generally set to match the mean tidal level or a commonly used (often national) ordinance level (like NAP in the Netherlands).
Three different time frames are used within the Argus Runtime Environment:
- Epochtime: represents the number of seconds since January 1, 1970, 00:00:00. This is the nine or ten-digit number an Argus image filename begins with. By nature, epochtimes are relative to GMT.
- Julian days: represents the serial number of a day within a year, e.g. Feb 1st = 32.
- Matlab’s ‘datenum’ time frame: represents the number of days since January 1, 0000, 00:00:00. Matlab times are obtained from the standard Matlab function datenum (see help on datenum). Matlab provides a set of standard functions to convert datenumbers to more accessible formats, the most important ones being datevec and datestr. See the Matlab help on timefun for further details regarding Matlab time processing.
See also
Internal links
Related articles:
- Argus video monitoring system
- Argus applications
- Argus standard image processing
- Shore nourishment and beach nourishments
External links
- Information about coastal imaging
- General information about Argus beach monitoring systems
- Argus image archive
- Introduction of the ARGUS technique
References
- ↑ Lippmann, T.C. and Holman R.A. (1989) Quantification of sand bar morphology: A video technique based on wave dissipation. Journal of Geophysical Research, 94 (C1), 995-1011, 1989
- ↑ Enckevort, I.M.J. Van and Ruessink, B.G. (2001) Effect of hydrodynamics and bathymetry on video estimates of nearshore sandbar position. Journal of Geophysical Research, 106(C8): 16969-16980, 2001
- ↑ Lippmann, T.C. and Holman R.A. (1990) The spatial and temporal variability of sand bar morphology, Journal of Geophysical Research, 95 (C7), 11,575-11,590, 1990
- ↑ Chickadel, C.C., R.A. Holman, and M. Freilich (2003) An optical technique for the measurement of longshore currents. Journal of Geophysical Research, 108 (C11), 3364, doi: 10.1029/2003JC001774, 2003
Please note that others may also have edited the contents of this article.
|